
Overview
Visual BACnet is an advanced visualization tool for Building Automation System (BAS) service providers. The powerful analytics engine quickly identifies common problems and anomalous behaviour in the BACnet infrastructure. The user-friendly tools allow you to:
- Assess the health of your BACnet system before and after working on it.
- Visualize network activity, anomalies, and patterns.
- Diagnose problems instantly with advanced diagnostic checks.
Follow this step-by-step guide for Visual BACnet Troubleshooting.
Capturing in Wireshark
In order to use Visual BACnet, you will need a packet capture, or pcap, file. Some building management software is able to capture these files remotely. Otherwise, begin by running Wireshark on the BAS. This will ensure that you get a complete system-level view of the Building Automation System. All global broadcast messages, communication with the BAS, and general network traffic will be captured.
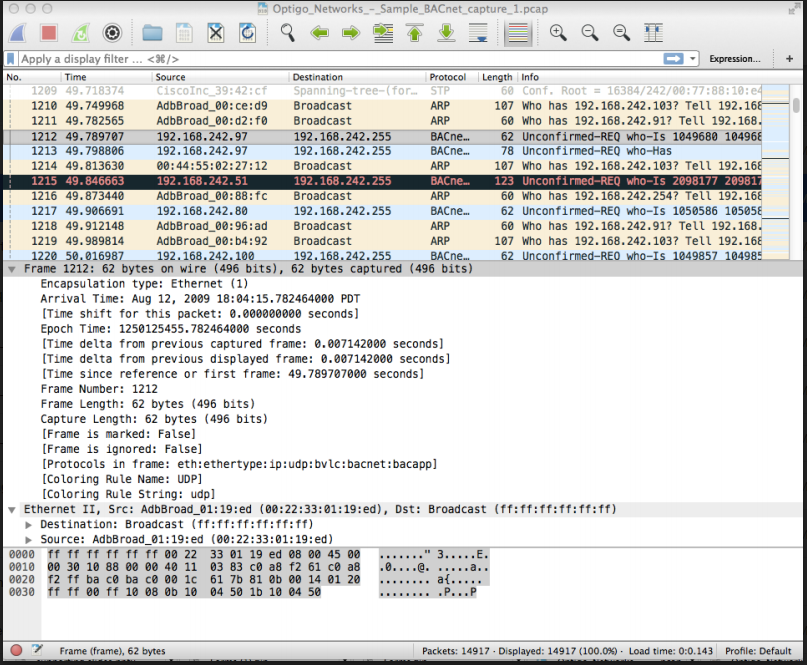
As a secondary step, you can also perform captures on each individual MS/TP network. This will capture all MS/TP traffic between controllers and devices that may not be seen by the BAS and higher level network. Analyzing this capture in Visual BACnet will expose any problems arising from token passing. Learn how to capture MS/TP traffic.
The optimal capture length will be dependent on the intended use of the pcap file.
To get a general system health check — perhaps after commissioning, before starting a job, or for regular audits — we recommend a one-hour capture.
Once a problem is identified, shorter captures can be used to troubleshoot. By initially looking at the longer pcap, you should be able to identify the cause or the frequency of the problem, or the time of day during which it occurs. Use this information to capture a pcap that is five to 20 minutes long, to see if your work fixed the problem and increased the network health. In some cases, it may be good to force a command or action during the capture period to ensure the fix is applied correctly (e.g. confirm reply on read-property is no longer an error).
|
Intended use of Visual BACnet |
Recommended capture length |
|
General system health check |
1 hour |
|
Troubleshooting and validating fix |
5-20 minutes |
If you are using Visual BACnet for a particular problem, ensure that the action or commands triggering the problem occur during the capture period. Note that some BAS and controllers include a packet capture feature, which are easy to use and require no additional software or hardware. Please ensure the capture file has an extension of .cap, .pcap, or .pcapng. If it does not by default, append a .cap before uploading to Visual BACnet. We recommend performing regular checks on your network’s health — monthly, weekly, or daily if possible — to ensure the system is running smoothly.
Custom BACnet Ports
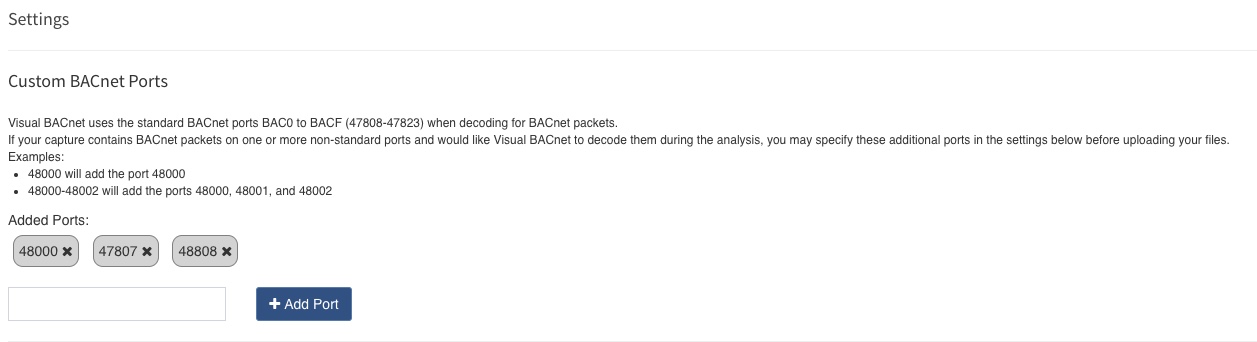
Visual BACnet uses the standard BACnet ports BAC0 to BACF (47808-47823) when decoding for BACnet packets. If your capture contains BACnet packets on one or more non-standard ports and you would like Visual BACnet to decode them during the analysis, you may specify these additional ports in the settings before uploading your files. Note that you must add these ports before uploading the file, for Visual BACnet to analyze all of your BACnet traffic.
First, click the dropdown menu in the top right hand corner, and select Settings.

You will arrive on a Custom BACnet Ports page. Here, you can add any non-standard BACnet ports that are on your network. Make sure you enter the numbers correctly: entering 48000 will add the port 48000, while 48000-48002 will add the ports 48000, 48001, and 48002. Click +Add Port when you are done entering these numbers.
Now drag and drop your PCAP file into Visual BACnet and find out how your system is doing.
Share by Email
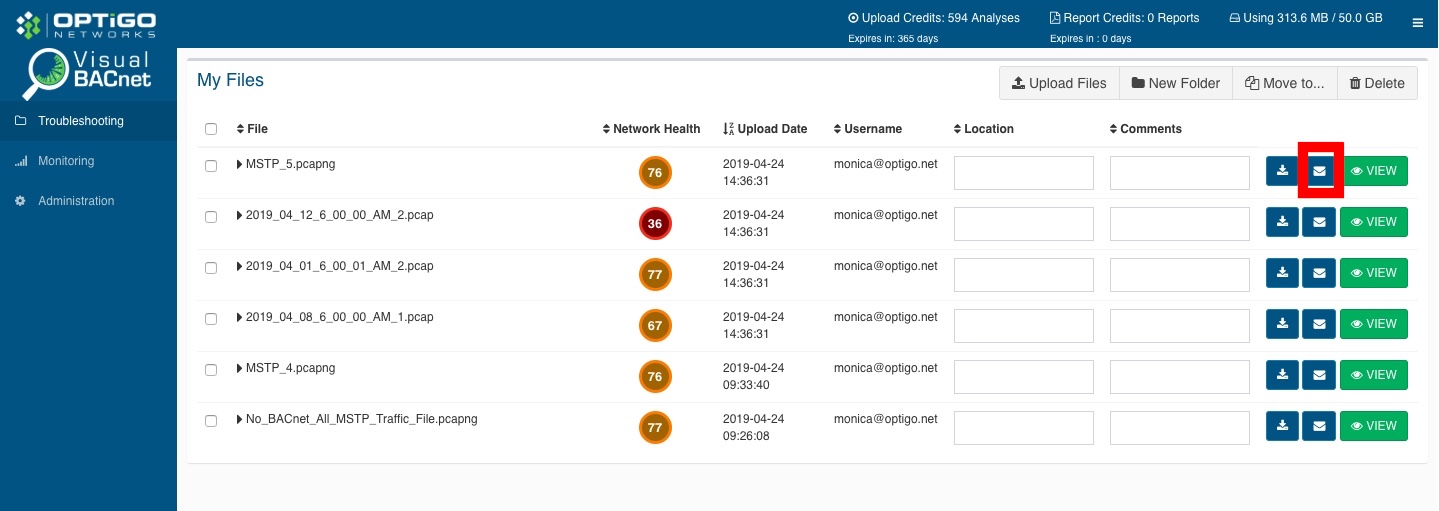
In the Troubleshooting My Files screen, you can share pcap files by email. Simply click on the blue mail icon on the right hand side of the file you wish to share. Note that only corporate email addresses are accepted (“@optigo.net” for example). Separate multiple email addresses with a comma or space, and hit share when you’re done.
How to Use Visual BACnet
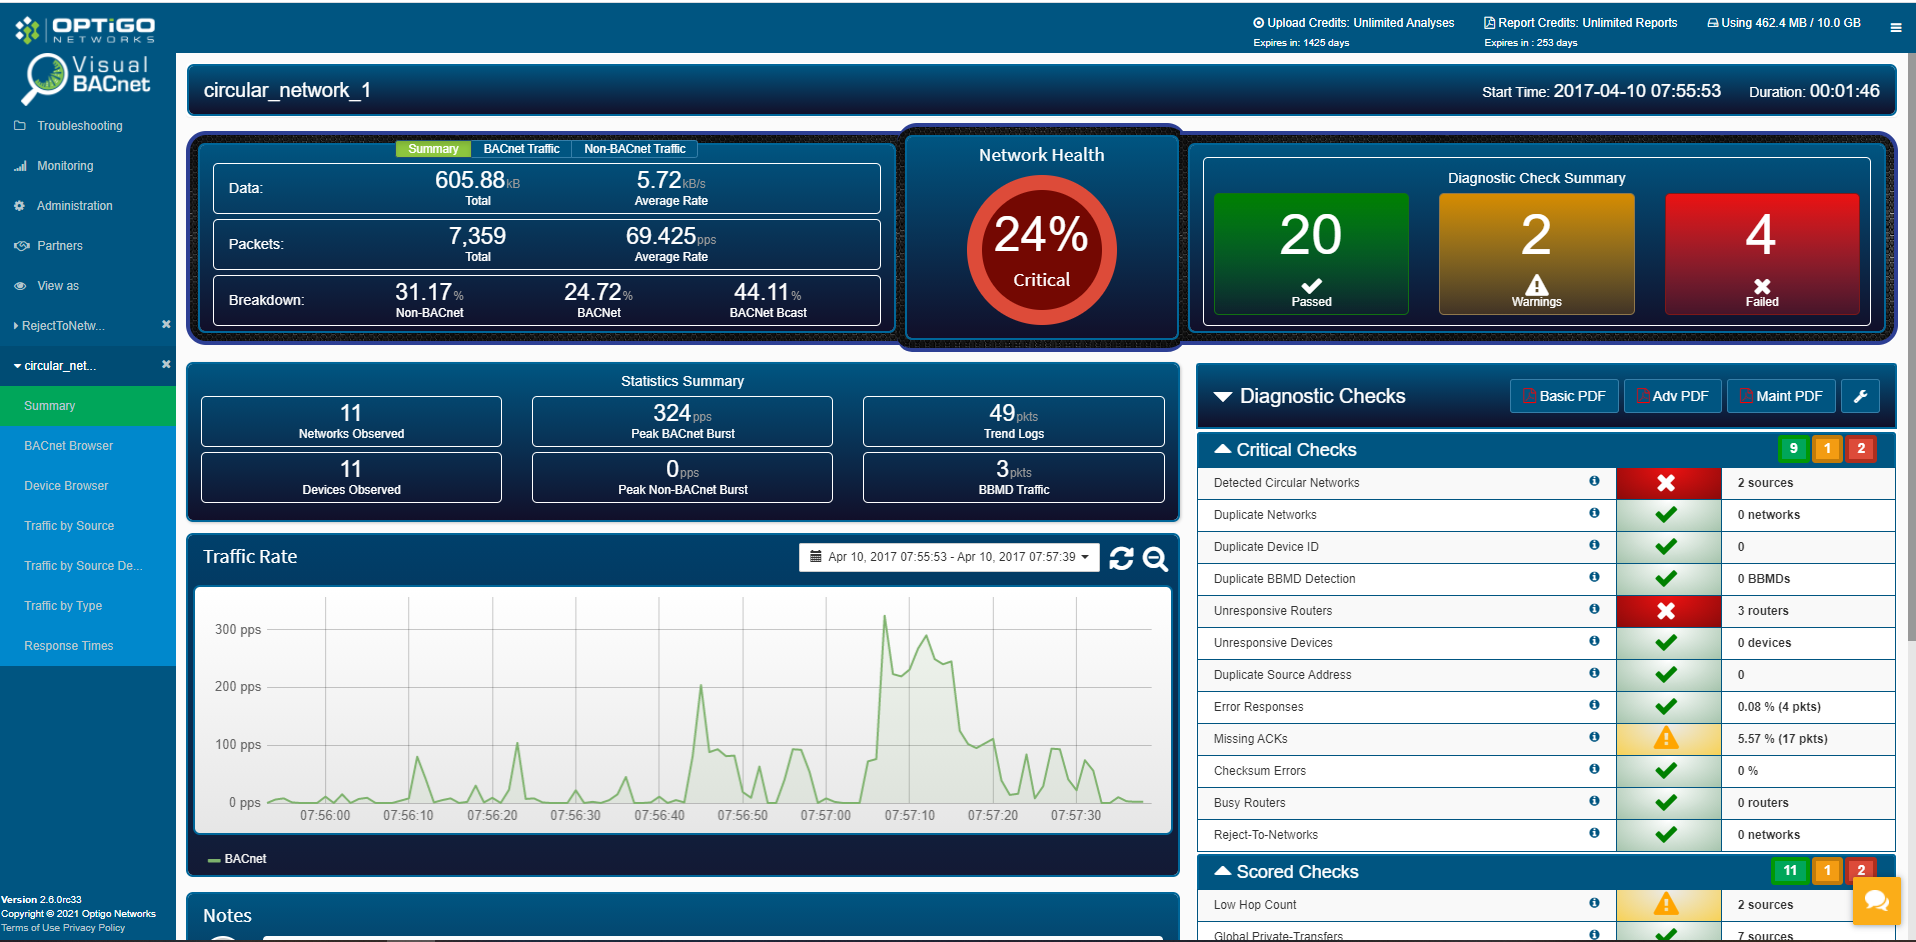
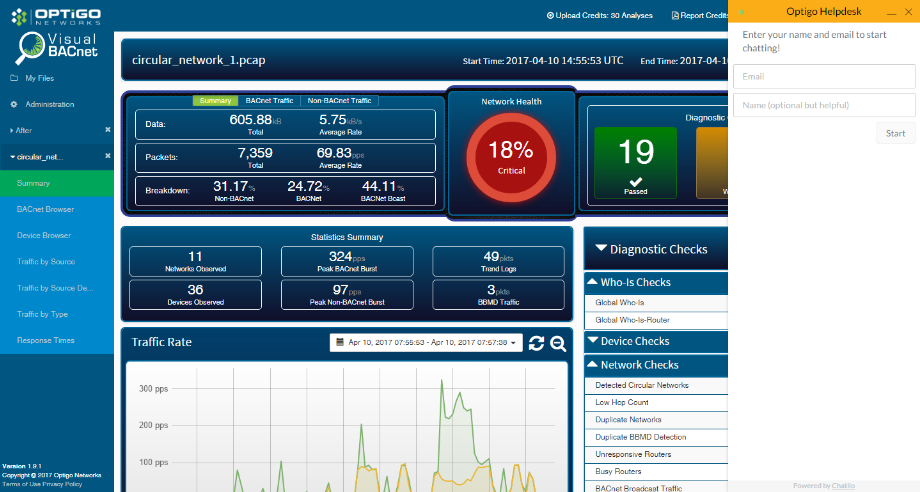
When you first click View in Visual BACnet, you will see a summary page of your network’s health. This includes a network health score, statistics summary, traffic rate, and diagnostic checks, among other tools and resources. Read on to understand how to use each of these features to assess and visualize your network’s condition.
Network Health

The Network Health gives your BACnet system a concrete score based on our diagnostic checks and the information in this capture. Click on the network health score to see a breakdown of where you lost or gained points. Click here to learn how the score is calculated.
Diagnostic Checks
The diagnostic checks use industry-accepted thresholds to analyze the information in your capture. The diagnostic checks are broken into 2 categories: critical and scored checks. Critical checks are things that absolutely should not fail in your network. Scored checks expose things that may be okay, but are happening too frequently in your network, causing problems. Click on each diagnostic check to learn more about it, and drill down to find the specific packets causing problems. You can also see the Diagnostic Checks by clicking on the Network Health Score . You will see the same checks broken down into critical or scored checks.

Summary
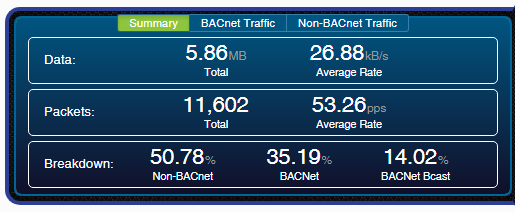
Use the summary information to learn about your file, and see how much BACnet traffic it contains. If there isn't enough BACnet traffic, the Health Score may not be completely reflective of your system.

Refer to the Statistics Summary to better understand what data was pulled from your packet capture. It details the number of BACnet networks identified in the system based on the current capture; the highest instantaneous rate (over a one-second period) of BACnet traffic from all sources in the capture; the number of BACnet packets with a trend object from the capture; the number of BACnet devices identified in the system based on the current capture; the highest instantaneous rate (over a one-second period) of non-BACnet or MS/TP traffic from all sources in the capture; and the number of BACnet packets with a Forwarded-NPDU BVLC function from the capture. Click on any of these to learn more and see the breakdown.
Traffic Rate

The traffic rate graph shows the number of packets per second for the entire duration of your capture. BACnet traffic is in green, and all non-BACnet or MS/TP traffic is yellow. (Depending on the file type, the legend will tell you if it’s Non-BACnet or MS/TP traffic.) To zoom in, drag your cursor over the time span you wish to view. To isolate the BACnet traffic, click on the word "BACnet" in the bottom left corner.
Click the refresh button to reset the graph and show the entire capture length.

Capture Settings and Generate PDF Report

Click the settings button to view the Capture Settings page. Here you can enable and disable diagnostic checks and view the threshold values of each diagnostic check.
The “Basic PDF”, “Adv PDF” and the “Maint PDF” buttons will download either a basic report, an advanced report, or a maintenance report. Advanced reports are an add-on that allows you to share the information in Visual BACnet with your stakeholders — your customers, your partners, or your boss. Advanced reports include the summary dashboard; PCAP file information; BACnet and non-BACnet traffic graph; statistics summary; network diagnostic checks and their values, colour-coded pass, warning, and failed checks; and an appendix of all the offenders in the warning and failed diagnostic checks. Basic reports give a less detailed description of the summary page, PCAP info, and statistics summary. The maintenance report is a highly customizable report that allows you to upload images and add comments, making them ideal for delivering to customers.
Learn more about the difference between Basic and Advanced Reports here.
Learn about Maintenance Reports here.
BACnet Browser and Device Browser

Use the BACnet Browser to inspect individual packets based on Source, Destination, PDU Type, or Network. Use the device browser to see the details on all of the devices that are active during this capture including the device ID, device type, encapsulation, BACnet address, IP address, MAC address, and vendor name (ID).
Traffic by Source Device

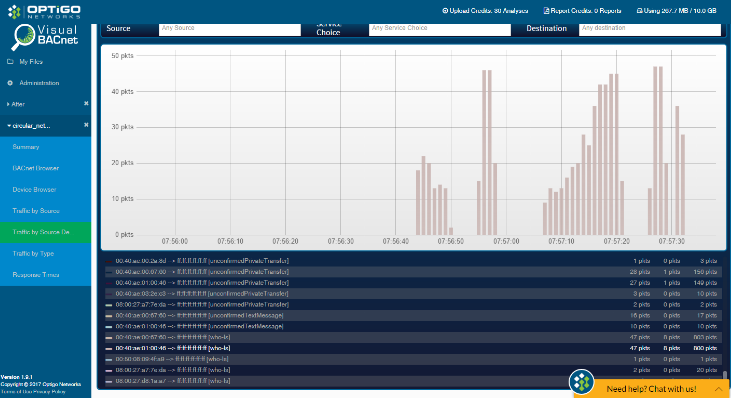
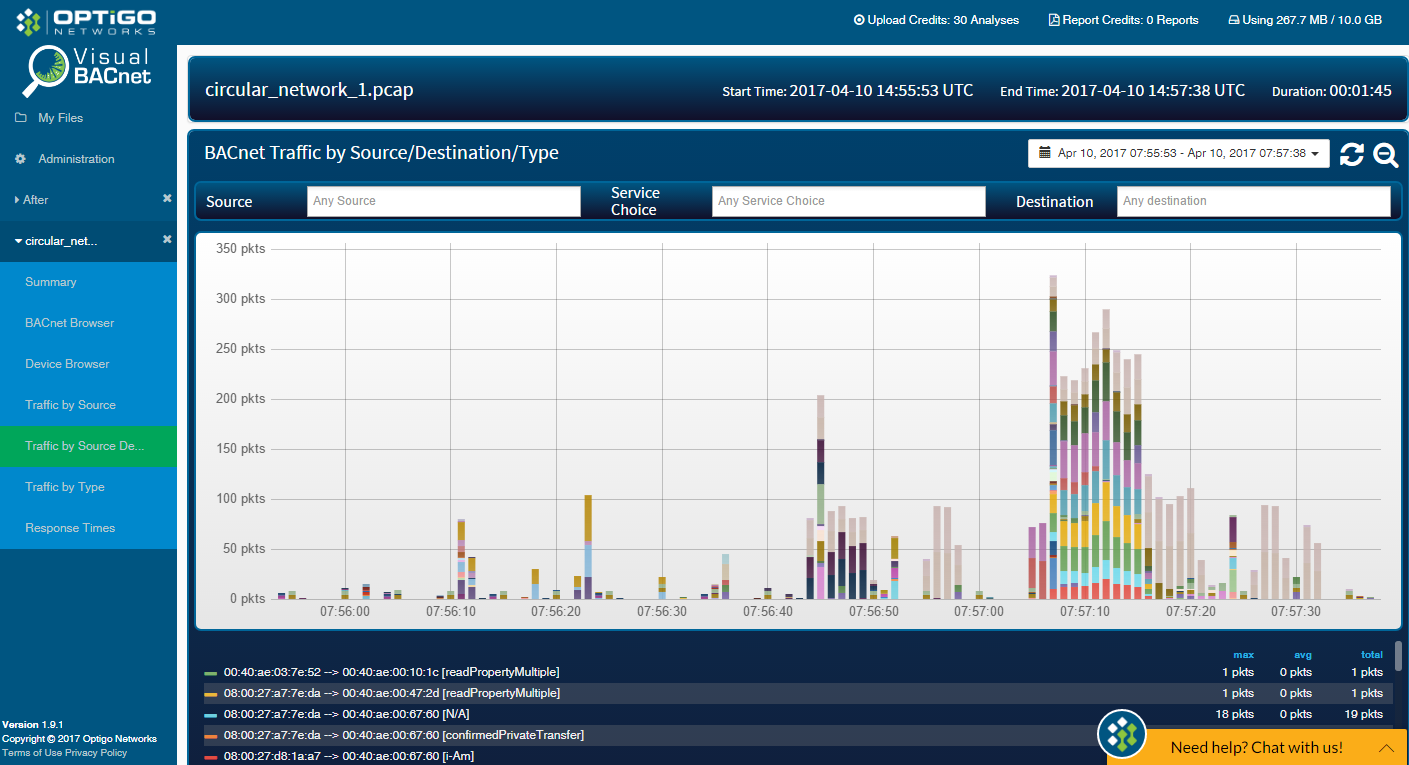
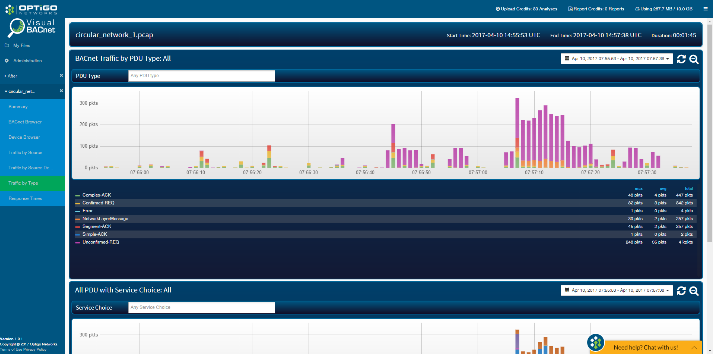
Use the graphs under Traffic by Source Device to view BACnet traffic and find patterns or anomalies. Activity is colour-coded in these graphs, allowing you to distinguish when the network is behaving strangely. To zoom in, drag your cursor over the time span you wish to view and see areas of increased or decreased activity.
A table below the graph shows the colour scheme, the time of event, the activity type, maximum number of packets, average number of packets, and total number of packets. Filter through by clicking on items in this table. For example, clicking on the item oo:40:ae:01:00:46 → ff:ff:ff:ff:ff:ff [who-Is] shows spikes in activity from 800 total packets.
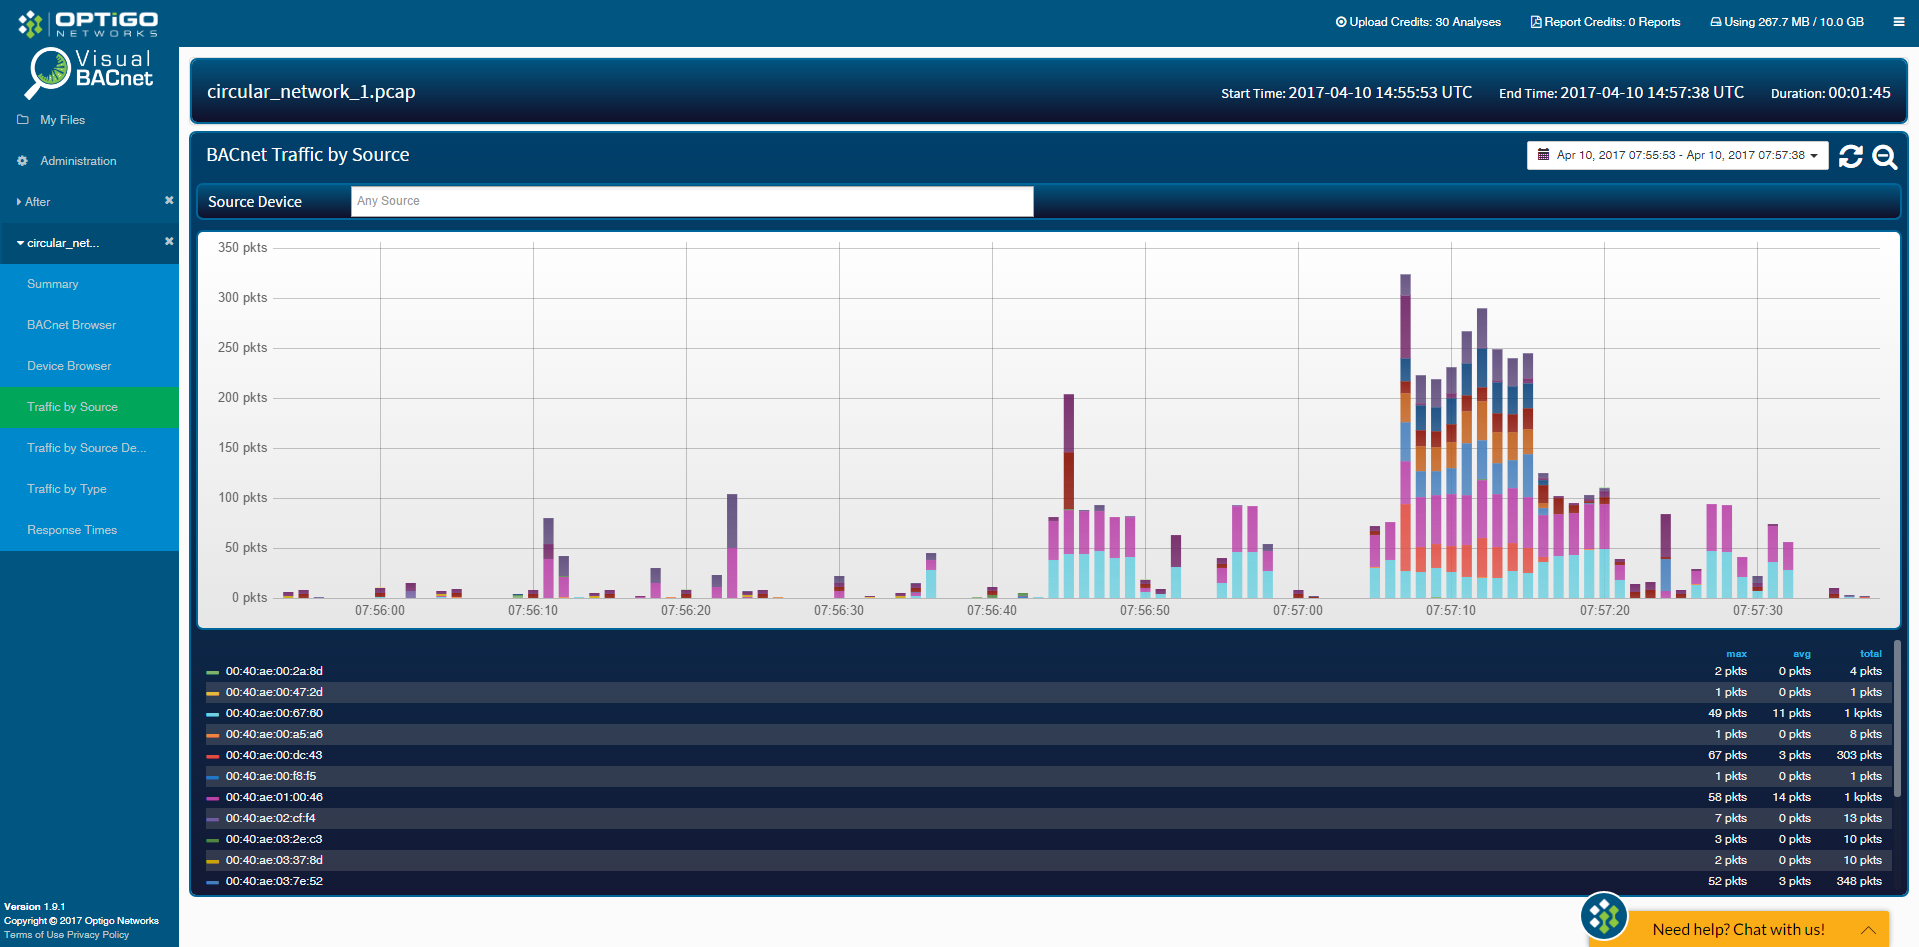
Two other graphs are important to understanding your network better. Traffic by source, for example, can help identify a chatty device. You can zoom in, isolate sources, and deep dive into network patterns.
Traffic by type can help figure out what types of traffic are happening in your network, giving you insight into what might be causing problems.
Notes
At the bottom of the network health summary screen, there is a box to add notes about the pcap file. You can choose to show these notes on any reports that you generate, by checking the box in the right hand corner. These notes will also show up on the file if you share it with anyone, or if it is in your team folder.

Chat
Having trouble navigating your pcap? Not sure what’s going on with your network? Our handy chat feature will be with you on every page of Visual BACnet, so whenever you need help you can call on one of our BACnet gurus. Just provide your name and email in the Optigo Helpdesk, and our support team will be happy to help.
For more help, email support@optigo.net or visit www.optigo.net/support
Comments
0 comments
Please sign in to leave a comment.